We are proud to announce the release of our first Splunk App, which can be used to perform a first high level analysis of Volatility’s results coming from multiple hosts. https://splunkbase.splunk.com/app/5220/

Introduction
Memory analysis has always been an interesting tasks and in the past decade the Volatility Framework has been seen as a de facto standard when talking about tools to perform efficient and reliable memory analysis.
Furthermore, during the last years, big data opened new ways of performing data analysis with different tools introduced in the market.
Thats why we decided to combine the reliability of volatility with the flexibility Splunk offers to create the “Volatility Triage App”.
The app consists in three practical dashboards which help you to identify not only outliers and low hanging fruits from one memory image, but potentially from dozens of memory images all in once. You can imagine importing the results (with the TA-volatility app, mentioned below) manually or automatically and then directly start the analysis without losing time with Excel or some complicated command line kung-fu.
The following chapters give an overview of how to import the data, the dashboards and some special functionalities we built in order to empower the end user.
Data Import
Our app relies on TA-volatiltiy (https://splunkbase.splunk.com/app/3919/) , which is a great app that ingest the JSON results of volatiltiy into Splunk. When you install the app a configuration page will guide you through the import. Data has to be organized per host and OS so the directory tree containing your results (the .json files) should look like this:
- linux
- host1
- imageinfo.json
- cmdline.json
- malfind.json
- …
- host2
- imageinfo.json
- cmdline.json
- malfind.json
- host1
- windows
- host3
- imageinfo.json
- cmdline.json
- malfind.json
- host4
- imageinfo.json
- cmdline.json
- malfind.json
- host3
- …..
As soon as your data is ready you can configure the TA-volatility app to ingest the data in the directory.
The app can parse different plugins results, but the ones used by the Volatility Triage App are the following:
- imageinfo
- pslist
- pstree
- psxview
- netscan
- modscan
- ldrmodules
- malfind
- yarascan
- driverirp
- ssdt
A special mention goes to “yarascan”. This plugin unfortunately does not support the unified output function provided for the other plugins. This means it is not possible to export the results into JSON from volatility. If you want to have the ability to analyze YARA scans, you have to “convert” (e.g. using a python script) the output of the command into something like:
{
  "rows":
     [
       ["win_registry","csrss.exe",14],
	     ["win_registry","csrss.exe",2],
	     ["win_registry","winlogon.exe",1],
	     ......
     ],
  "columns":
     ["rule","process_name","pid"]
}
The output has to be grouped by rule and then a row containing the rule name, process name, and PID has to be created. Afterwards you can copy the converted output into a file, rename it to “yarascan.json” and import it.
So before installing and proceeding with the other steps, install this app and import all data for the available hosts.
Installation
The app can be installed like every other Splunk app available.
Note that there are some dependancies in order to have all functionalities working:
- Data Import (MUST HAVE): TA-Volatility (as mentioned above)
- Visualization of process tree: Sankey Diagram (https://splunkbase.splunk.com/app/3112/)
- Visualization of network connections: Force Directed Visualization App (https://splunkbase.splunk.com/app/3767/)
For the Sankey Diagram and Force Directed Visualization, there is no additional configuration to be made.
Dashboards
Once your data has been successfully imported and you have installed the app on your Search Head, you can start using the app.
Three dashboards are provided:
- Overview
- Host Analyzer
- Process Analyzer
Here we give a description of all three.
Overview
In this first dashboard you will find overview results grouped by all machine imported. This view can already give you interesting results when analyzing for example all unique command lines or IP addresses found.
Here an example of unique processes and command line found:
The network map visualizes the connection made to other IPs. Exclude common internal destination networks to have a more concise graph:
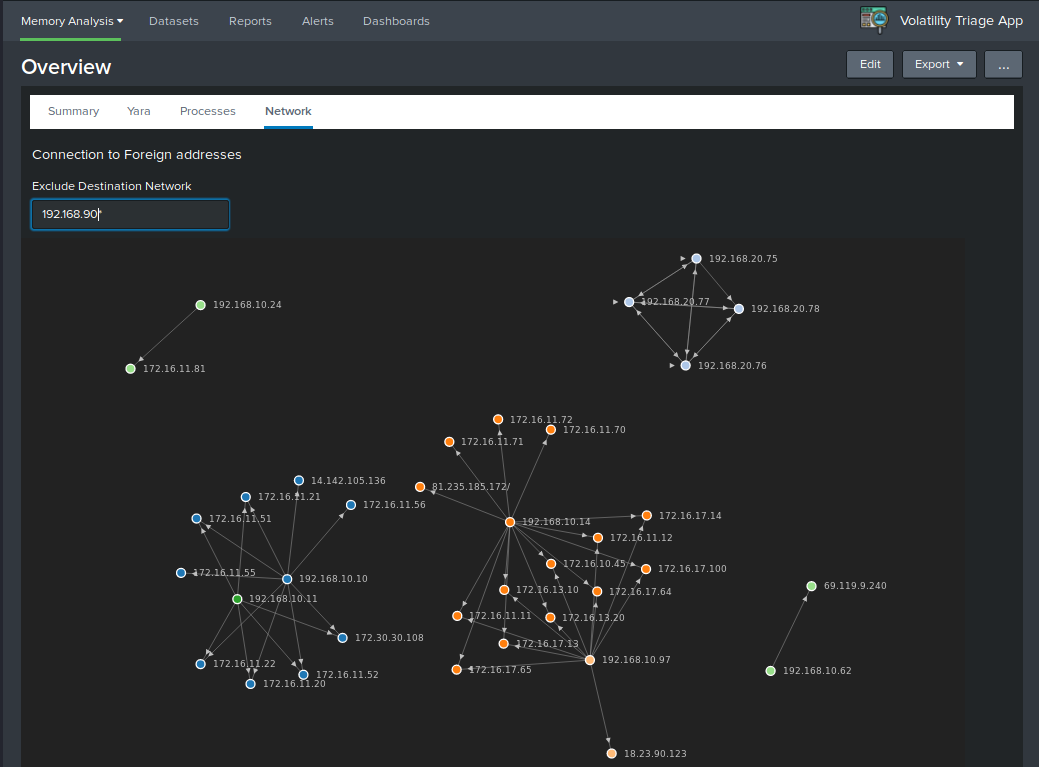
Note that besided the network graph, also a unique list of IP addresses is provided in the network overview.
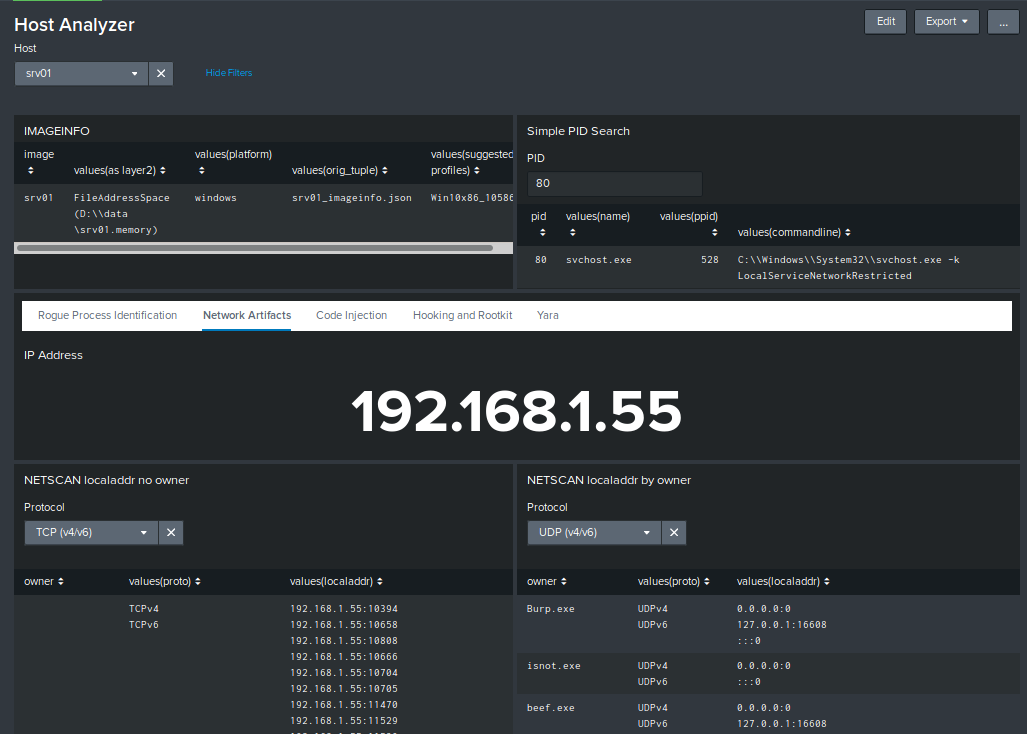
Host Analyzer
The host analyzer dashboard visualizes results grouped per host. It offers a more detailed view in comparison to the overview.
Different aspects of the results relative to the host can be analyzed:
- Rogue Process Identification using psxview, pslist, and cmdline
- Review of the network artifacts
- Identifying traces of code injection with the help of ldrmodules and malfind
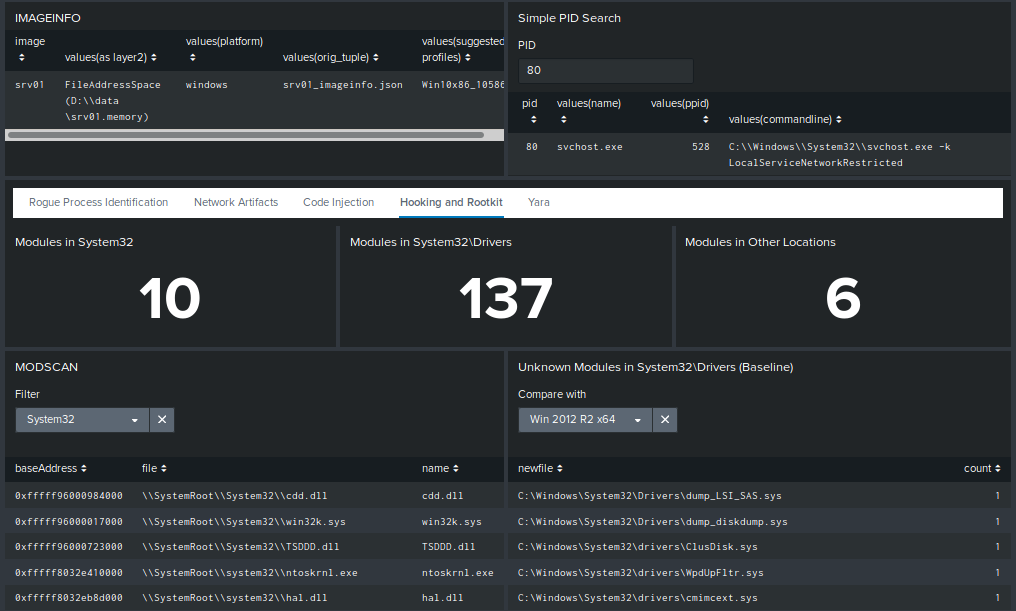
- Find easily detectable hooks and rootkits with modscan and ssdt
In this case we can see the network information for host “srv01”:
One interesting point in the “Hooking and Rootkit” sub-dashboard is the ability to compare the drivers found in the image with the ones found in Windows 2012 R2 x64 and Windows 10 x64 default installations. This drastically reduces the number of false positive (note that the comparison is solely performed on the name of the driver not on the content) :
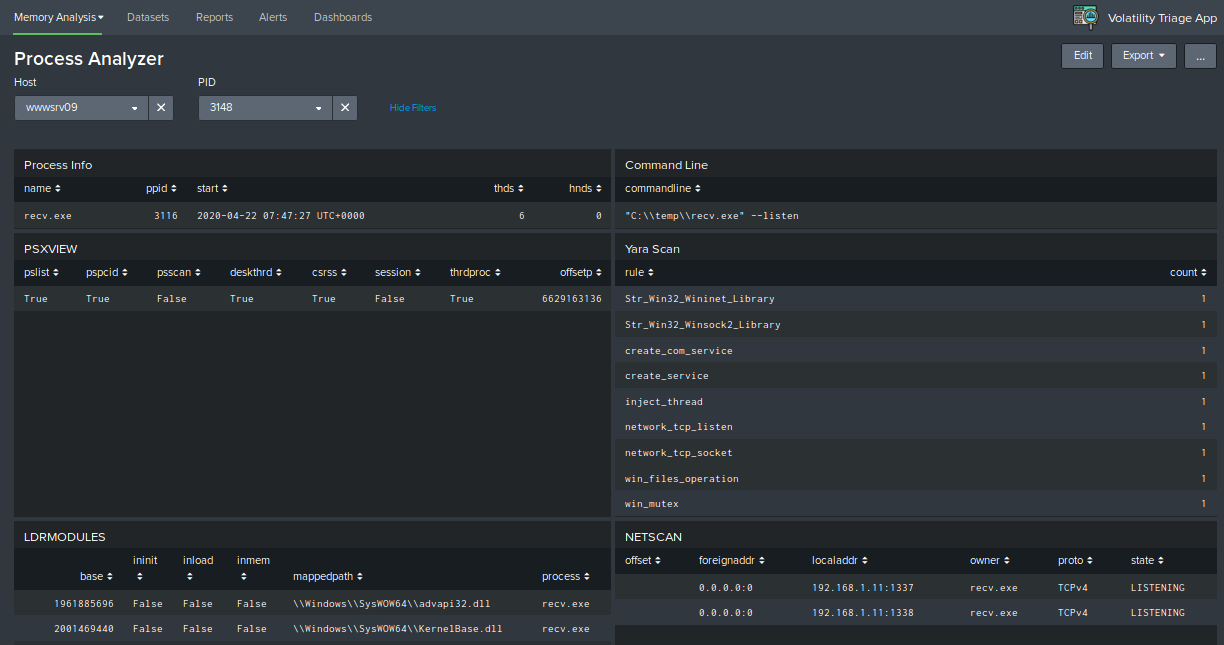
Process Analyzer
This last dashboard offer a granular view of only one single process. In case you find a suspicious process, this view gives the possibility to have in one screen all important information about the behavior of the process.
For example you could correlate the command line parameters with a network connection and a YARA hit.
Here an example of a suspicious process and its properties:
Special Features
During the creation of the app, we developed a special command called “malfindtoasm”. This command is in fact used to display the assembly code relative to the hexadecimal output of the malfind command.
The following fields are visualized when importing the malfind results:
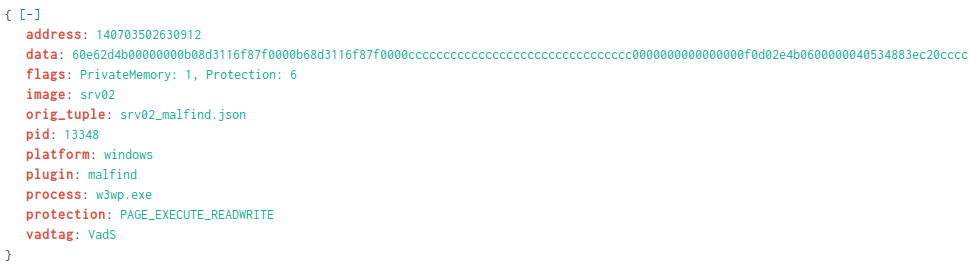
You can see the “data” field. Malfind will displays this directly in assembly when working on the command line. However, when converting the results to JSON, the assembly cannot be stored in a pratical way rather than this, so we though it would be a nice idea to have a sort of visualizer to perform also other searches (like for examples all JMPs) easily in Splunk.
We then developed the command “malfindtoasm”:
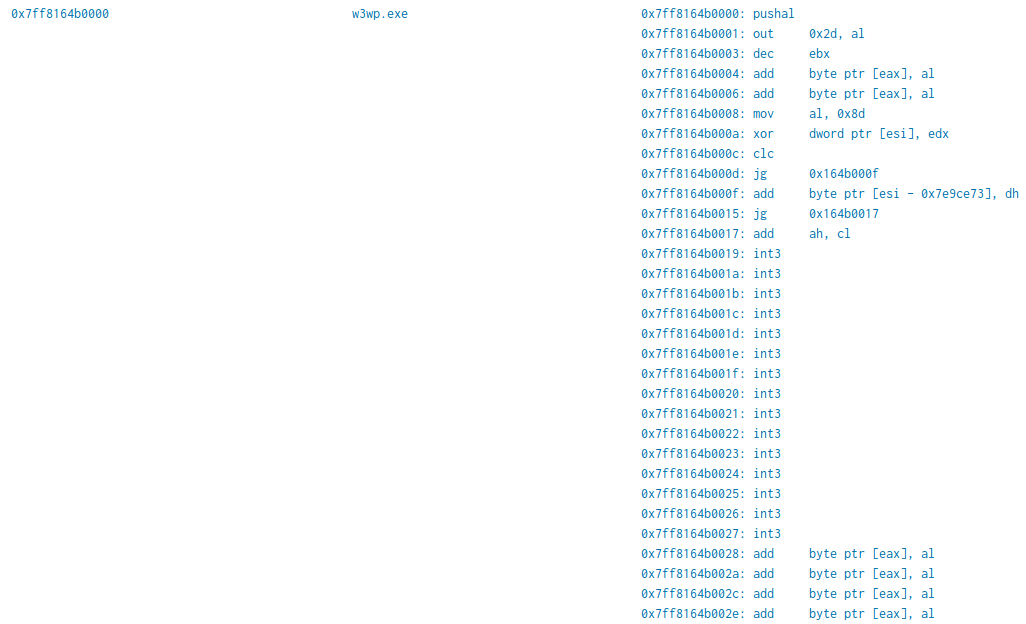
The “data” field is now a human readable assembly (note that the command will expect x86 assembly as input and will output x86 assembly as well). It is also possible to see how the instructions follows the base address.
This command can be piped to a standard search containing the malfind output and a new field called “asm” will be appended to the event:
source=*malfind.json image=srv02| malfindtoasm | eval baseAddress=printf("0x%x",address) | stats values(asm),count by baseAddress,process
This allows different searches to be performed if you are looking for specific assembly and you perfer to use the command names instead of the opcode.
This command is a simple python script which makes use of the capstone disassembler (https://www.capstone-engine.org/lang_python.html). You can find its implementation in the app source code.
Improvements
The app its in his first version and has potential to offer more functionalities in future releases. Here some possible improvements:
- Support x64 assembly into the “malfindtoasm” command
- Possibility to create group of hosts (in case you want for example all unique commands relative only to a subset of hosts) and pivot the three dashboards accordingly
- IP Reputation check for the unique addresses found
Acknowledgment
A special thanks to the creators of the TA-volatility app for having published such a practical app. Furthermore, two Splunk searches inside the dashboards (the process tree visualization using the Sankey diagram and the “psxview” rating table) have been taken from the examples provided in the TA-volatility app.
Special thanks also to the authors of “The Art of Memory Forensics: Detecting Malware and Threats in Windows, Linux, and Mac Memory” (ISBN-13: 978-1118825099, ISBN-10: 1118825098) for publishing a book full of insights about the memory and volatility in particular.
Leave a Reply